01
Choose the comparison first
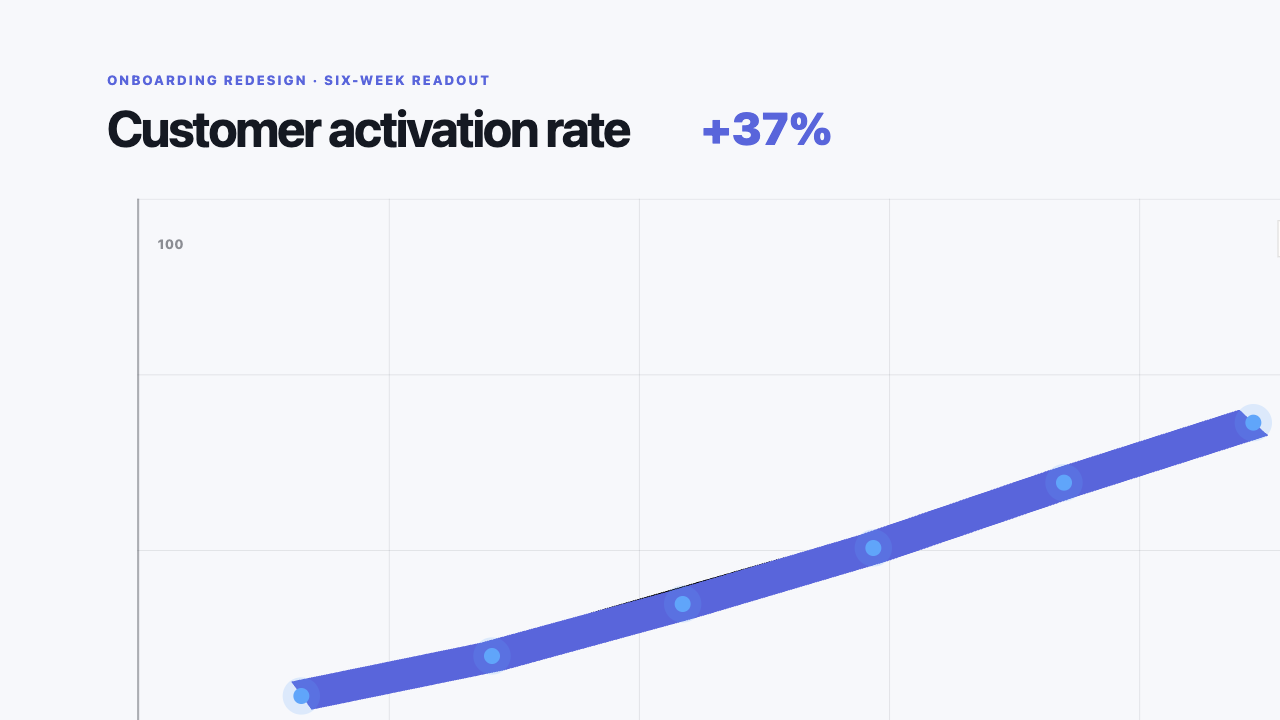
Use lines for change over time, bars for category comparison, stacked charts for composition, Sankey diagrams for flow, and counters for a single headline metric.
02
Reduce before animating
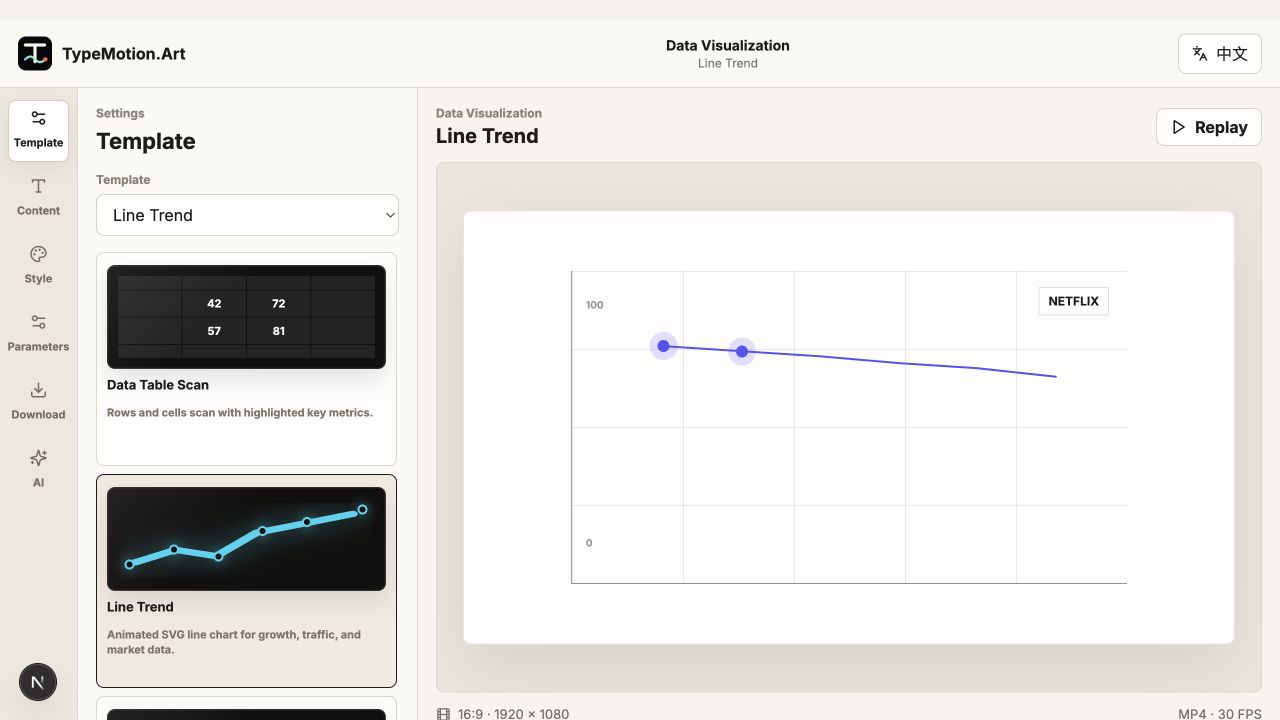
Remove rows, decimals, grid lines, and labels that do not support the takeaway. Animation cannot rescue a chart whose comparison is unclear.
03
Animate in reading order
Introduce the frame and axes, then the data, then the annotation or takeaway. For rankings and bar races, keep enough time between changes for viewers to track position.